


India’s Office Leasing Hits Records, Yet Occupancy Growth Slows: Why?
India Office Leasing 2026: Record Activity, Slower Growth
SHARE:
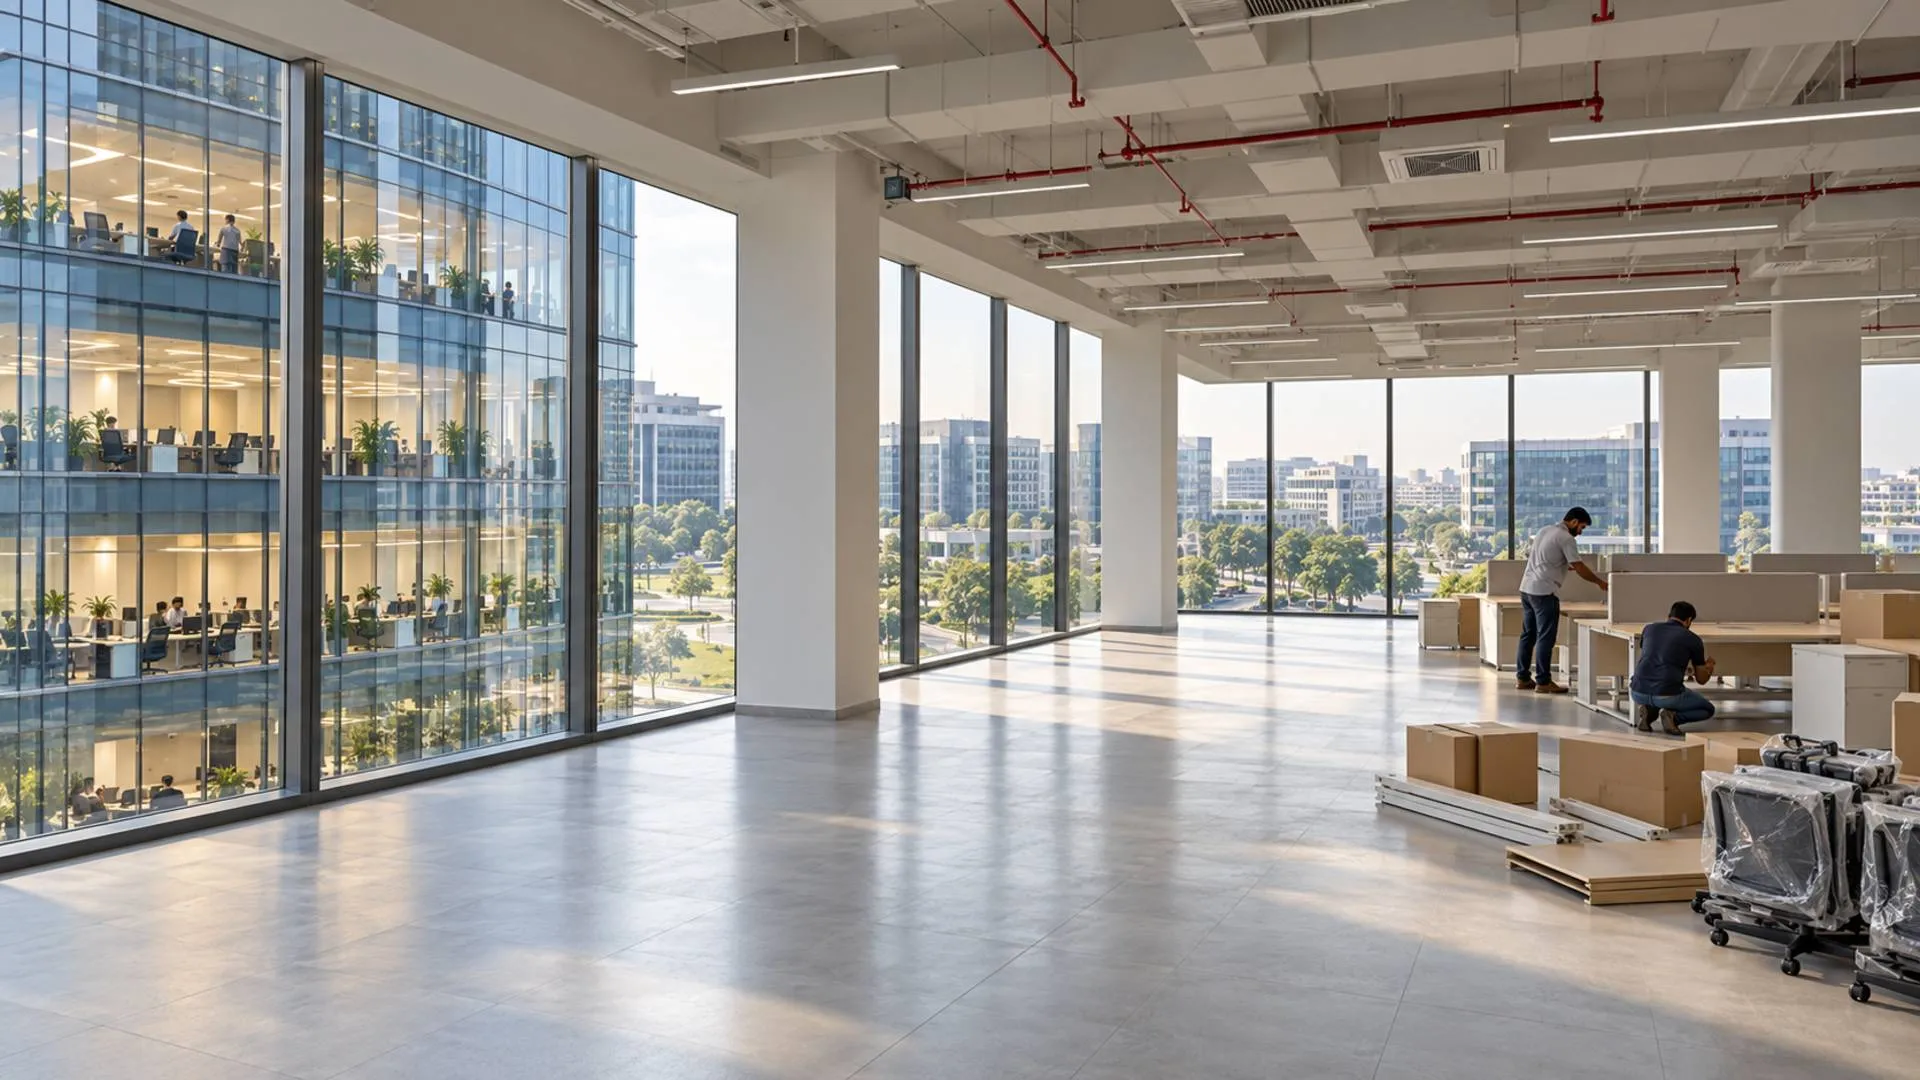
India’s office market is producing two headlines that seem difficult to reconcile: leasing activity has reached a record, yet the addition of occupied space has slowed.
Both can be true.
Gross office leasing reached 64.6 million sq ft during January–September 2026, while net absorption fell 20% year on year to 36.7 million sq ft, according to Cushman & Wakefield figures reported by Rediff.
The explanation begins with what each measure counts. Companies can renew leases, reserve future space or move between buildings without creating an equivalent increase in occupied office stock.
For developers and investors following the India office market in 2026, this distinction changes how a leasing announcement should be interpreted. A busy transaction market does not guarantee that every building fills quickly, or that every landlord benefits equally.
India’s office leasing hit a record; why is occupancy growth still slowing?
Gross leasing includes transactions such as renewals and pre-leasing, while net absorption measures the change in occupied space. Relocations can leave vacancies behind, and future commitments do not necessarily translate into immediate occupation. Supply timing, building quality and a strong previous-year comparison also help explain the gap.
Record leasing and slower absorption measure different things
The first step is to separate three commonly confused indicators.
|
Indicator |
What it describes |
|
Gross leasing |
Transaction activity, including categories defined by the research provider |
|
Net absorption |
Change in occupied office space during a period |
|
Vacancy rate |
Unoccupied space as a proportion of the relevant office stock |
Cushman & Wakefield’s reporting includes renewals and pre-leasing within gross activity. It attributes the weaker nine-month net absorption to a strong 2025 base and limited suitable supply during the first half.
A simple hypothetical example illustrates the difference. A company renewing its existing 100,000 sq ft lease generates transaction activity but does not occupy another 100,000 sq ft. A business relocating into a similar-sized building can also leave space behind.
The record describes activity; net absorption describes the resulting change in occupied stock.
Slower net absorption therefore does not mean occupied space is shrinking. A positive net addition of 36.7 million sq ft still represents growth, although less than in the comparable period.
Neither measure directly counts employees at their desks. Property occupancy and daily workplace attendance are separate questions.
Supply can be scarce early in the year and abundant later
The supply explanation initially sounds counterintuitive. How can limited available offices constrain occupation when developers are delivering more buildings?
Timing and suitability matter.
An occupier seeking a large, contiguous floor plate in a particular location cannot necessarily substitute several smaller spaces elsewhere. A building scheduled for completion later also cannot resolve an immediate requirement.
The Economic Times’ October 10 report, citing Cushman & Wakefield, says stronger September-quarter completions would create capacity for further expansion. It also describes occupiers planning through pre-commitments.
The practical inference is that a signed commitment and a usable workplace can fall into different reporting periods. Construction, handover and fit-outs may separate the transaction from occupation.
This is why investors should examine the delivery and occupation schedule rather than relying on the signing date alone.
A lease in a completed, income-producing building and a commitment to future space can both be positive developments. They provide different evidence about immediate cash flow.
More occupied space can still leave a higher vacancy rate
Vacancy depends on both occupation and total stock.
Imagine a hypothetical market with 100 units of office space, of which 85 are occupied. Vacancy is 15%.
If developers add 20 units and occupied space increases by 12, the market has 120 units in total and 97 occupied. Occupancy has grown, but vacancy rises to approximately 19.2%.
That example is arithmetic, not an Indian market statistic. It shows why rising vacancy is not automatically evidence of falling demand.
The latest Knight Frank update published by Passionate in Marketing reports that occupied stock increased 6.8% year on year, while vacancy reached 14.7% in Q3 2026, compared with 14.5% a year earlier. Its report attributes the change to heavier supply, completion timing and location.
A supply wave can raise vacancy even while businesses occupy more space. The relevant question is whether new stock is being absorbed at a sustainable pace.
GCC growth is changing the occupier mix
The leasing story also reflects a shift in who is taking space.
Global capability centres, companies’ own operations supporting international business functions, are becoming more important alongside flexible workspace operators and India-facing businesses.
Knight Frank reports that third-party IT/ITeS leasing fell 36% year on year during January–September 2026, while GCC transactions increased 10.4% to 27.4 million sq ft. Flex transactions rose 14% to 16.1 million sq ft.
This does not mean technology-related office demand has vanished. It means different occupier categories are contributing differently.
Flex space also needs careful interpretation. An operator’s lease creates activity in the office property market, while the subsequent occupation of desks by client businesses is a separate operating measure. Operator-leased area should not be treated as proof that every workstation is already in use.
For developers, the changing mix makes tenant requirements more important. For investors, it creates a reason to examine the business model behind the lease, rather than treating all signed area as identical demand.
Grade A demand can coexist with weaker buildings
India’s office market is not moving uniformly across building types.
Fortune India’s May 2026 report, citing ANAROCK, describes a widening divide between Grade A workplaces and older, secondary stock. It reports Q1 2026 Grade A vacancy of 15.5%, while vacancy in older and secondary-grade buildings ranged from 20% to 25%.
Those figures concern an earlier period and a different research dataset. They should not be presented as October vacancy readings.
They nevertheless illustrate an important issue: a company upgrading to a better building can strengthen demand at its destination while leaving its previous landlord with a vacancy.
For commercial real estate investment in India, building quality therefore matters alongside city growth. Assess services, accessibility, upkeep and the property’s suitability for prospective tenants.
A record national leasing figure cannot compensate for an asset that occupiers repeatedly reject.
City comparisons need matching measures
Cushman & Wakefield’s nine-month reporting shows net absorption increasing in Bengaluru, Hyderabad and Ahmedabad, while declining in Mumbai, Delhi-NCR, Pune, Chennai and Kolkata. These are changes in absorption, not rankings of current vacancy or daily office attendance.
Knight Frank’s separate Q3 figures show vacancy falling in Hyderabad and Mumbai but rising in Delhi-NCR. Its report also records annual rental growth across all eight tracked markets.
Different periods, coverage and methodologies can produce different-looking results without invalidating either report.
News First Prime’s October article, citing CBRE, reports 66.4 million sq ft of January–September activity, up 8% annually. That figure should not be substituted for Cushman & Wakefield’s 64.6 million sq ft series.
For Pune property investment, the same discipline applies at the neighbourhood level. The supplied reporting does not establish a specific occupancy ranking for Hinjewadi or Kharadi.
What the gap means for investors and homebuyers
For an office investment or office REIT assessment, examine the asset’s leased area, income-producing area, lease commencement dates, tenant obligations and competing supply. A commitment to occupy matters, but so does when rent becomes payable.
For a buyer considering a flat near an IT park, office leasing is an economic signal rather than a residential price forecast. Employment, actual occupation, commuting choices and housing supply determine how that signal reaches the neighbourhood.
Before buying a flat in Hinjewadi or Kharadi, verify local rents and travel routes. Avoid assuming that every new lease brings an equivalent number of new households.
The record office leasing–occupancy growth gap in India in 2026 ultimately describes a market where transactions, building delivery and occupation are progressing at different speeds.