High Streets Capture 68% of Retail Leasing: Why Locations Matter
High Streets Capture 68% of India’s Retail Leasing in 2026
SHARE:
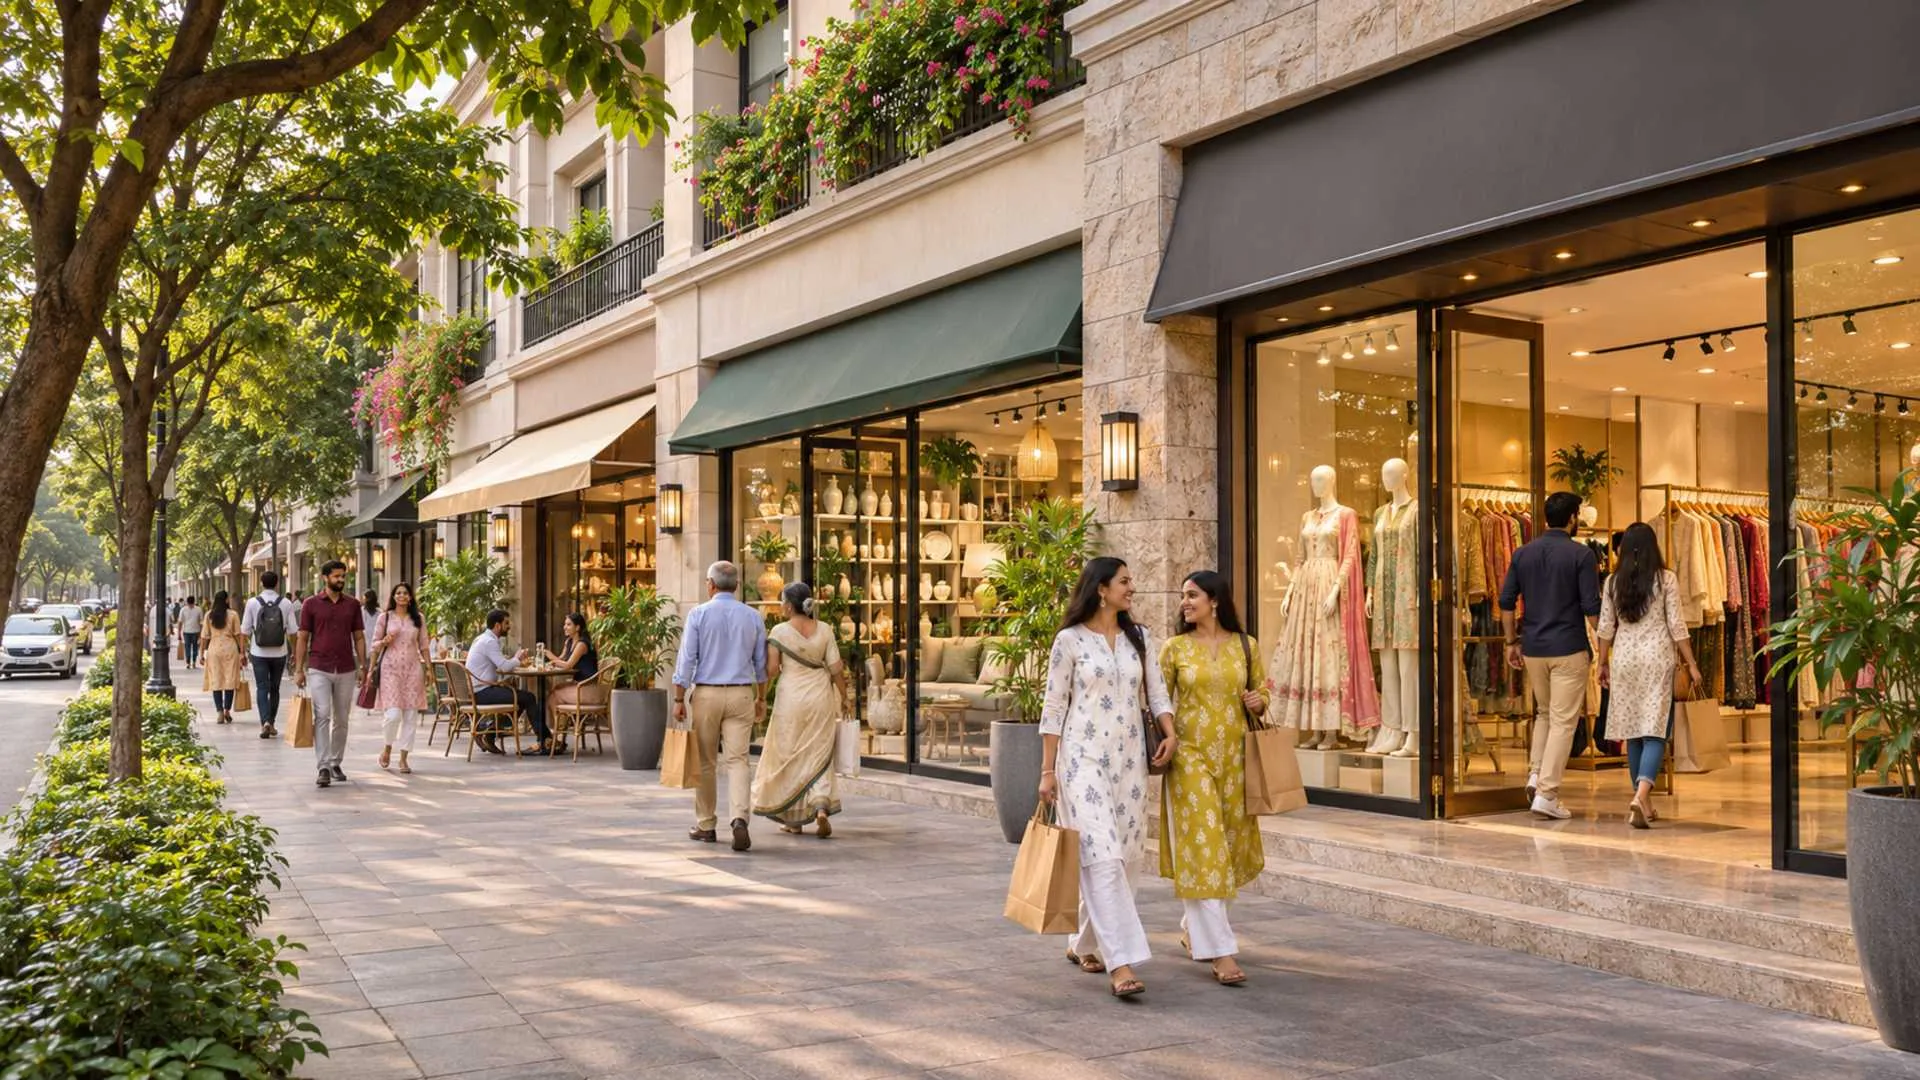


India’s retail sector has continued to change. Approximately 68% of retail lettings in 8 major cities were for ‘front-of-house’ retail in Q3 2026.
Despite this trend, retailers are looking for spaces that will provide them with adequate space, good client access and strong store profitability. Quality space within malls is limited.
For investors looking at retail lettings within India in 2026, a busy retail street can provide a good source of visibility and regular traffic. However, the best investment opportunities will come from individual shops.
Why are high streets beating malls in India retail leasing?
High streets captured 67.9% of Q3 2026 leasing as brands sought prominent locations while quality mall availability remained constrained. Main-street leasing rose 33.1% annually, while mall leasing fell 37.8%. The shift reflects both street-level demand and limited mall supply, rather than evidence that malls are becoming irrelevant.
High Street Versus Mall Retail Leasing: What the Numbers Show
Vantage’s analysis of Cushman & Wakefield data reports that total retail leasing reached 2.22 million sq ft in Q3 2026, down 4.4% year-on-year. Within that total, the two formats moved in different directions.
| Measure | High streets/main streets | Shopping malls |
|---|---|---|
| Q3 2026 leasing | 1.51 million sq ft | 0.71 million sq ft |
| Share of quarterly leasing | 67.9% | 32.1% |
| Year-on-year change | +33.1% | −37.8% |
Source: Cushman & Wakefield, as reported by Vantage. Figures are rounded.
The headline therefore concerns high streets’ 68% share of retail leasing in India in Q3 2026. It is not their share of all retail property, shopper spending or investment returns.
Nor did high streets lead every quarter. Cushman & Wakefield’s Q2 release put malls at 51.3% of leasing, against 48.7% for main streets. The quarterly reversal shows why “high street versus mall, which is winning in 2026?” needs a reporting period attached.
Why Mall Leasing Fell Despite Tight Occupancy
A nearly 38% fall in mall leasing can sound like weakening consumer demand. The supply position suggests a more complicated explanation.
Business Standard’s October report attributes the decline to supply constraints and highlights the limited availability of premium retail space. Retailers cannot lease units that are already occupied or unsuitable for their requirements.
Meanwhile, Cushman & Wakefield’s Q3 release recorded Grade A mall vacancy of 4.8%, down from 5% in Q2, with no new Grade A mall supply for the third consecutive quarter.
Low mall leasing and low mall vacancy can coexist. Together, they indicate that the availability of suitable space is limiting transactions.
This is how a mall supply crunch can redirect brands towards high-street locations. A retailer seeking a particular catchment may choose an available street-facing store rather than postpone expansion while waiting for the right mall unit.
Why Brands Are Choosing High-Street Stores
Main-street retail leasing offers a different relationship with the customer. A visible frontage can place a brand along an existing commute, neighbourhood shopping route or evening dining circuit.
For a café, beauty retailer or convenience-led format, repeated local visits may matter more than a destination’s total weekend footfall. For experiential retail, the shopfront itself can become part of consumer engagement.
Nikhil Aggarwal’s supplied LinkedIn commentary argues that malls and high streets serve different shopping occasions. That is a useful interpretation; its investment-return claims should not be treated as verified benchmarks.
The occupier mix also matters. Cushman & Wakefield reports that fashion, F&B, and accessories and lifestyle accounted for 57.2% of Q3 leasing. These categories have different requirements for frontage, store depth, services and customer dwell time.
An international brand entering India may value a flagship high-street address, while another may prefer a managed mall’s tenant mix and operating environment. The best retail locations in India for brand expansion depend on the format, not prestige alone.
India’s Most Expensive Shopping Streets: Compare the Correct Year
Khan Market remains the reference point for expensive Indian retail addresses. Cushman & Wakefield’s Main Streets Across the World 2025 release ranked it 24th globally, with annual rent of US$223 per sq ft. That is a 2025 ranking, not a newly established 2026 position.
The following table reproduces the 2025 Indian top ten reported by Business Standard:
| Reported Indian position | High street | Annual rent: US$/sq ft, 2025 |
|---|---|---|
| 1 | Khan Market, Delhi | 223 |
| 2 | Connaught Place, Delhi | 169 |
| 3 | Galleria Market, Gurugram | 169 |
| 4 | Linking Road, Mumbai | 124 |
| 5 | Park Street, Kolkata | 88 |
| 6 | Fort/Fountain, Mumbai | 76 |
| 7 | Kemps Corner, Mumbai | 74 |
| 8 | Brigade Road, Bengaluru | 56 |
| 9 | Vittal Mallya Road, Bengaluru | 55 |
| 10 | MG Road, Pune | 49 |
Source: Cushman & Wakefield’s 2025 report, as presented by Business Standard. These are historical annual benchmarks, not current shop quotations.
For a more recent Khan Market Delhi rental-rate comparison, Moneycontrol’s July 2026 report cited Q2 asking rents of ₹1,700–₹1,800 per sq ft per month. Connaught Place’s Inner Circle was ₹1,250–₹1,300, while Galleria Market was ₹1,250–₹1,350. The benchmarks concerned ground-floor vanilla stores on a carpet-area basis.
Annual dollar rents and monthly rupee rents should never be compared without adjusting the units and dates.
Where Are High-Street Rents Growing?
The best high-street retail locations for rental growth in 2026 cannot be identified by rent level alone. An expensive address and a fast-growing address are different things.
Cushman & Wakefield’s Q2 2026 release reported these year-on-year rental increases:
| High street | Q2 2026 annual rental growth |
|---|---|
| Linking Road, Mumbai | 22% |
| Indiranagar 100 Feet Road, Bengaluru | 12% |
| Anna Nagar 2nd Avenue, Chennai | 11% |
| CG Road, Ahmedabad | 11% |
| Khan Market, Delhi | 9% |
Source: Cushman & Wakefield, Q2 2026.
These figures support a Linking Road-versus-Indiranagar rental-growth comparison for that quarter. They should not be relabelled as Q3 figures.
Likewise, Anna Nagar’s verified 11% rental increase should not be confused with an unverified claim of 57% leasing growth. Street rents, citywide leasing and transaction volumes measure different things.
For Q3, Cushman & Wakefield reported average prime high-street rental growth of 6.8% annually, with increases remaining selective and location-specific. Delhi NCR led total retail leasing, followed by Hyderabad and Mumbai.
Pune: MG Road’s Ranking Is Only the Starting Point
MG Road Pune appeared tenth in the cited 2025 Indian ranking, below Brigade Road Bengaluru. That does not establish its current rental growth or the suitability of every available shop.
For FC Road and JM Road Pune high-street retail locations, compare the actual frontage, pedestrian movement, access and surrounding retail mix.
The current Cushman & Wakefield Pune MarketBeat summary identifies Wagholi and Hadapsar among Q3 high-street activity corridors. It does not establish NIBM Road as the quarter’s leading location. A claim of strong NIBM Road retail leasing demand needs separate transaction evidence.
The Mall Pipeline Could Change the Balance Again
The “46 million sq ft retail pipeline between 2026 and 2030” keyword needs a date correction.
JLL’s February 2025 analysis identified 46.5 million sq ft of proposed and under-construction mall supply for 2025–2030. It was a conditional development pipeline, not completed stock.
JLL’s newer September 2026 outlook projects approximately 51.1 million sq ft of new mall supply by 2031 across seven cities. These estimates use different reporting horizons and should not be merged.
New malls could give brands more expansion choices. High streets will still compete through catchment access, visibility and customer convenience. The future is likely to involve both formats serving different requirements.
What the 68% Share Means for Retail Property Investors
The shift strengthens the case for investigating retail real estate investment trends in India, but leasing share is not an investment yield.
Before buying a high-street shop or comparing it with a mall unit, examine:
- Customer access: pedestrian flow, parking, crossings and delivery access.
- Store suitability: frontage, floor, visibility, utilities and permitted use.
- Lease quality: tenant strength, lock-in, escalation and exit clauses.
- Net income: vacancy, fit-out obligations, maintenance, taxes and acquisition costs.
A retail shop for rent on MG Road, Pune and a flagship space on Linking Road, Mumbai serve different budgets and customer bases. The strongest commercial retail investment is the one whose rent is sustainable for its tenant.
India’s high streets captured 68% of Q3 leasing because location and available space aligned, not because every street-facing shop became a winning investment.