

Pune Real Estate Q3 2026: Prices Rise as Buyers Turn Premium
Pune Real Estate Q3 2026: Prices Rise as Buyers Turn Premium
SHARE:
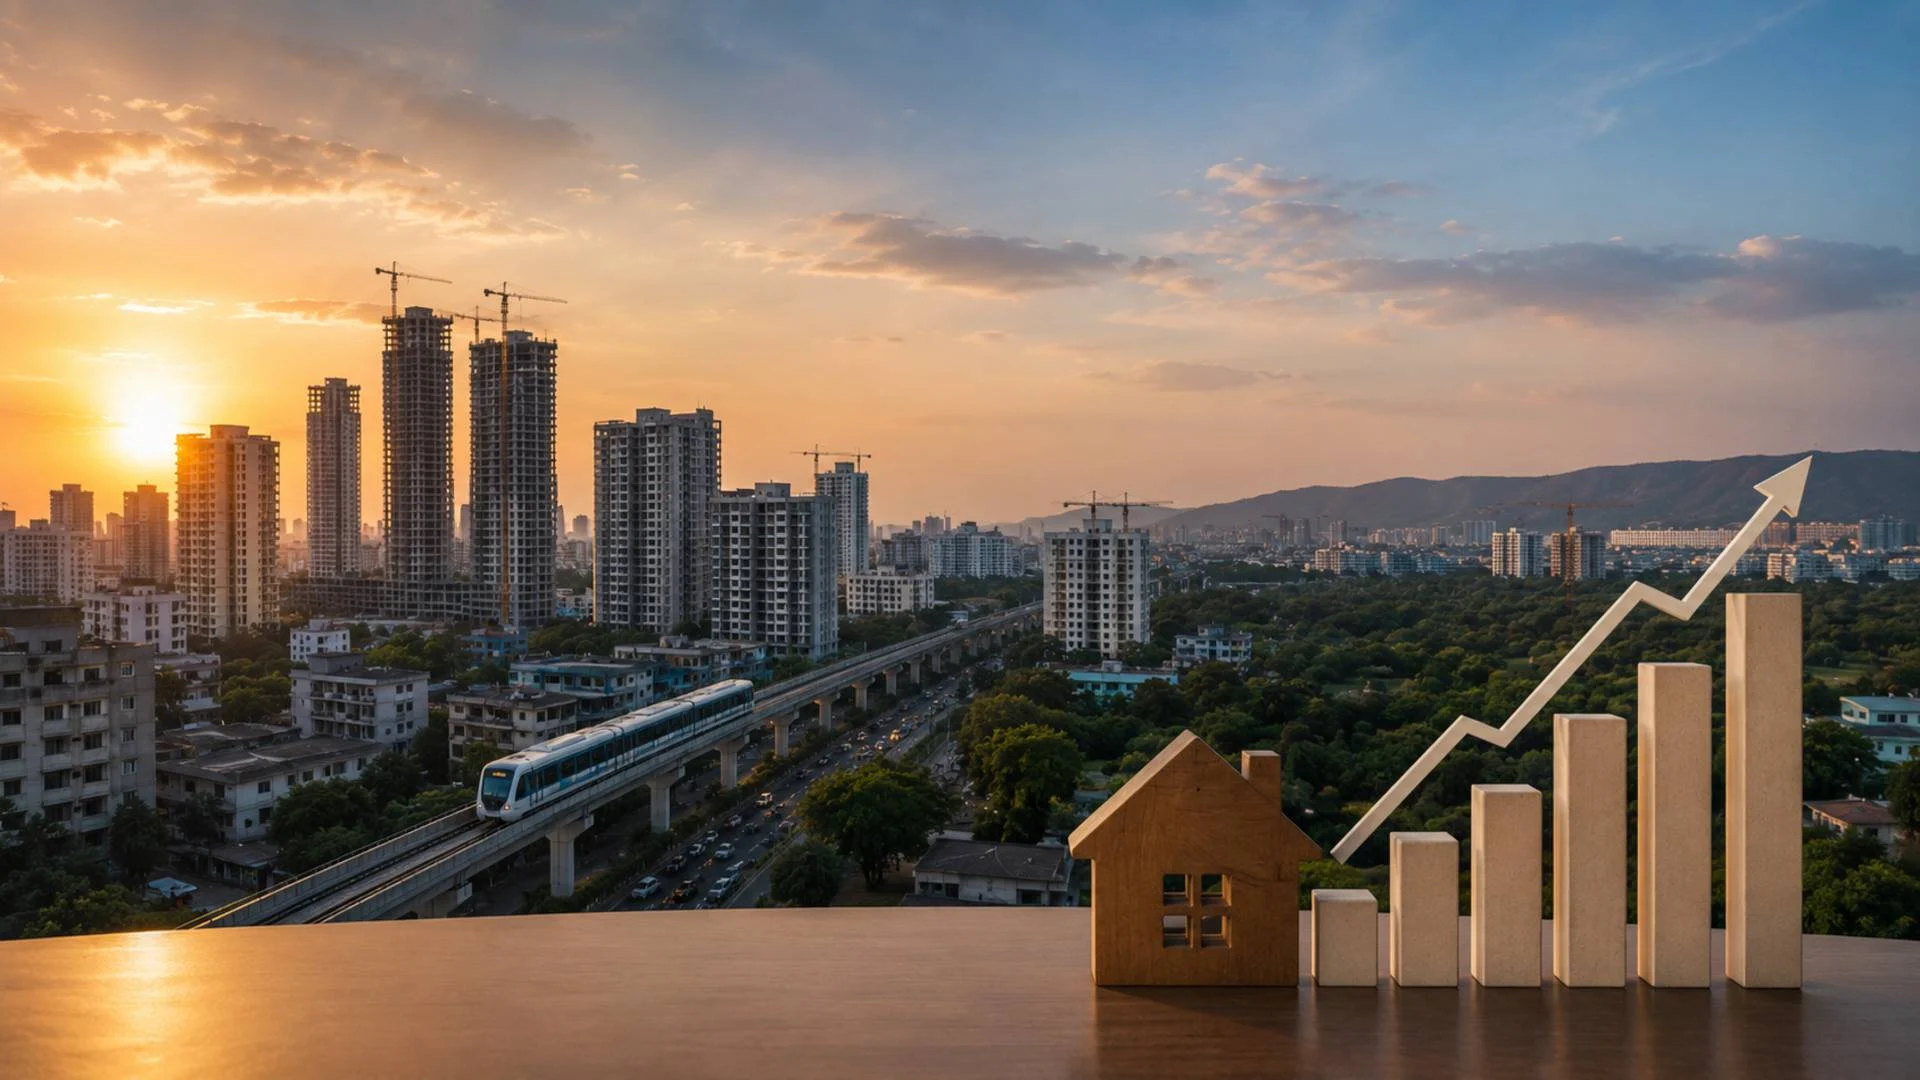
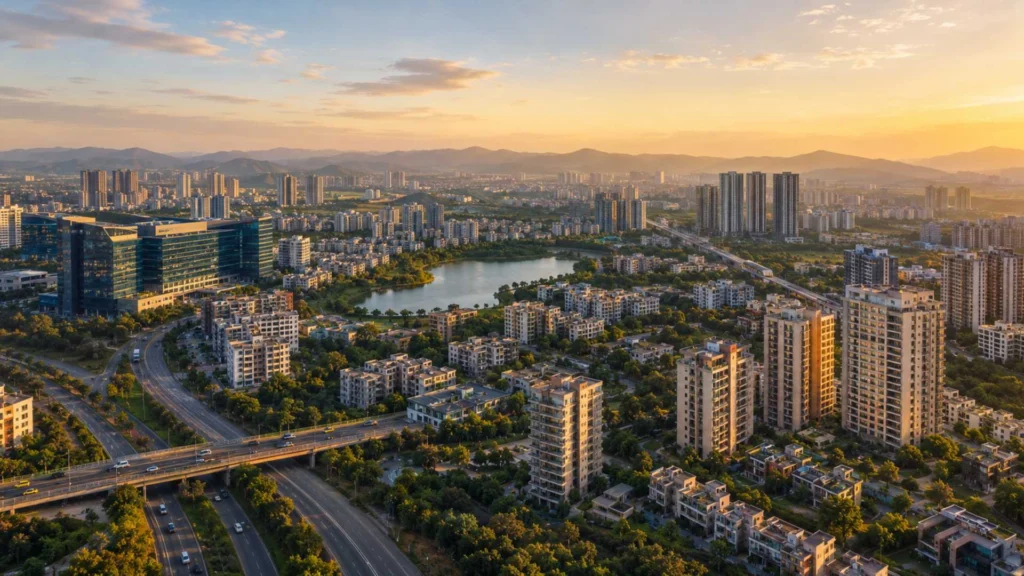
In the third quarter of 2026, the housing market in Pune has experienced a rare situation in that sales volumes are no longer rising at the rate they did during the period of post-pandemic growth, even though buyers are spending more, developers are launching projects vigorously, and property prices remain on the rise.
The Pune real estate market report for Q3 2026 is based on this story.
The number of homes entering the quarter is large. The July 2026 Pune Housing Report by CRE Matrix and CREDAI Pune states that 44,265 homes valued at ₹37,048 crore were sold in the first half of 2026 and that the average value of a home sold amounted to ₹84 lakh, which is 38% higher than in the first half of 2022. (CRE Matrix)
In the same period, Cushman & Wakefield reported 13,756 residential launches, which was the highest level of supply seen in three years. Capital values increased by 5.4% from quarter to quarter and rental growth persisted in areas driven by the IT sector such as Hinjawadi, Kharadi and Nagar Road. (Cushman & Wakefield)
If you add those numbers together, Pune’s market appears not so much like a boom losing its momentum as rather like one switching from volume-driven growth to higher-value, more premium housing.
What Is the Current State of Pune Real Estate Market in 2026?
Pune’s real estate market remains strong entering Q3 2026, although sales have moderated from recent peaks. H1 recorded 44,265 home sales worth ₹37,048 crore, while the average home sold for ₹84 lakh. Pune’s average residential price reached approximately ₹10,543 per sq ft, 20% above H1 2022. Premium housing is gaining share, while IT-led North-East and West Pune corridors continue to attract demand. (CRE Matrix)
This distinction is important for anyone asking about the status of the Pune real estate market in Q3 2026.
The market is not universally accelerating. It is becoming more selective.
CRE Matrix notes that overall sales have moderated compared with the exceptional levels of the past few years, with much of that softening concentrated in lower and mid-income housing. Premium and luxury demand, however, has remained comparatively resilient. (PuneNow)
And one statistic captures Pune’s transformation particularly well: sales of homes priced above ₹2 crore have increased 220% compared with H1 2022, according to CRE Matrix. (CRE Matrix)
Yet Pune has not abandoned affordability. Nearly 74% of H1 2026 homes sold remained below ₹1 crore, while the ₹50 lakh–₹1 crore segment continued to be the market’s largest category. (Punekar News)
Pune is premiumising without becoming exclusively premium. That may be its biggest competitive advantage.
The ₹84 Lakh Home Is Pune’s New Market Signal
The Pune housing market analysis for July August 2026 begins with a figure buyers may notice more than sales volumes: ₹84 lakh.
That is now the average value of a home sold, according to CRE Matrix and CREDAI Pune, representing 38% growth since H1 2022. Total transaction value has climbed 42% over the same comparison period. (CRE Matrix)
At the same time, the citywide average residential price has reached approximately ₹10,543 per sq ft, up 20% since H1 2022. (CRE Matrix)
That makes the keyword Pune ₹10543 per sq ft average 20% increase H1 2022 one of the clearest summaries of what has happened to affordability.
But there is a twist.
Home values have risen faster than average per-square-foot prices. That suggests Pune’s premiumisation story is not simply about developers charging more for the same product. Buyers are also shifting toward higher-ticket housing, larger configurations and better-positioned projects.
This is why the Pune average home price of ₹84 lakh and 38% growth in 2022 statistic matters: it reveals how buyer preferences are changing.
North-East Pune Has Become the Market’s Value-Growth Story
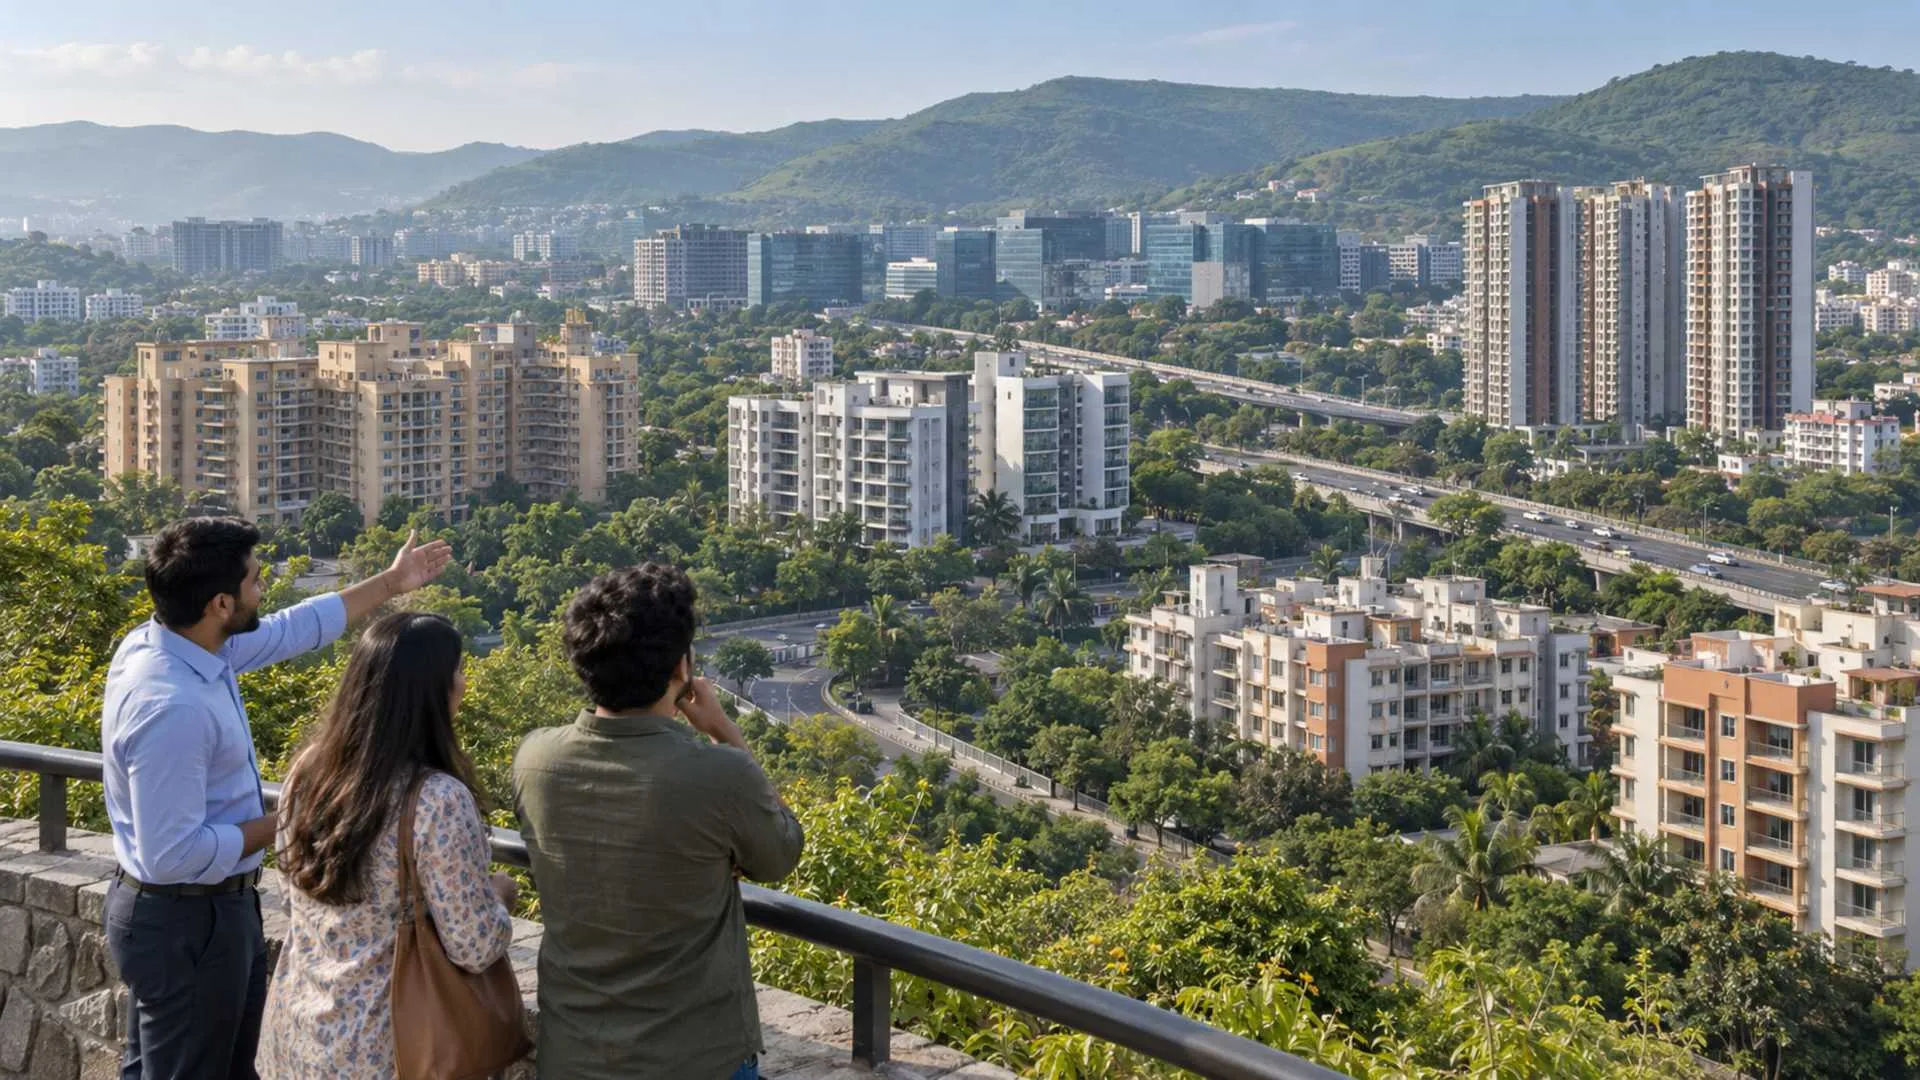
If there is one standout corridor entering Q3, it is North-East Pune.
The CREDAI Pune-CRE Matrix data shows North-East Pune recorded 54% growth in average home values since 2022, the strongest increase among the city’s macro-markets on that measure. The corridor includes Kharadi, Wagholi and surrounding eastern employment-linked locations. (Punekar News)
That validates the search trend around Pune North East Kharadi Wagholi 54% appreciation since 2022, with one clarification: the 54% refers to growth in average home value, not necessarily a 54% rise in every property’s price per square foot.
Kharadi remains central to this story because of its office ecosystem and access to East Pune employment. For buyers researching Kharadi ₹8500-₹14500 per sq ft Q3 2026 trend, current portal estimates vary by project and property type, so the range should be treated as indicative rather than a uniform locality rate.
Wagholi continues to provide a lower entry point. NoBroker’s April 2026 Pune rate guide broadly places Wagholi and Moshi in the ₹5,000–₹8,000 per sq ft bracket, compared with roughly ₹8,000–₹14,000 for Hinjawadi and Kharadi. (NoBroker)
This is precisely why Wagholi affordable ₹5000-₹7500 per sq ft in 2026 continues to attract searches: buyers can potentially participate in East Pune’s employment story without paying core Kharadi prices.
South-West Pune Is Quietly Winning the Appreciation Race
North-East Pune leads in growth of average home value. But another corridor wins a different contest.
According to CRE Matrix, Pune South West recorded 24% growth in average price per square foot since H1 2022, the highest among the major Pune micro-markets. (CRE Matrix)
So the keyword Pune South West 24% highest appreciation corridor 2026 has data behind it, provided the timeframe is stated correctly.
The distinction matters.
A rise in average home value can result from buyers purchasing larger or more premium homes. Growth in price per square foot provides a different lens on underlying property values.
For investors asking which Pune micro-market is performing best in Q3 2026, there is no single answer.
North-East wins on average home-value growth since 2022; South-West leads on per-square-foot appreciation over the same H1 comparison period.
That is a much more useful picture than declaring one Pune neighbourhood the “next hotspot.”
West Pune Is Moving From IT Corridor to Premium Corridor
West Pune remains one of the city’s most closely watched residential zones.
The Pune North West Baner Wakad Hinjewadi premium position is being reinforced by a combination of employment access, social infrastructure and increasingly expensive new launches.
Baner demonstrates how far the market has moved. NoBroker currently puts broad Baner asking rates at approximately ₹10,500–₹15,000 per sq ft, while Magicbricks reported an average multi-storey apartment rate of around ₹11,460 per sq ft in June 2026. Premium individual projects can reach substantially higher. (NoBroker)
That broadly supports searches for Baner Balewadi ₹12000-₹15000 per sq ft in Q3 2026, but buyers should remember that project-level prices can vary significantly.
Wakad is following the same direction at a different price point. Project-level data from Square Yards shows one Wakad development, Rishi Olive, moving from ₹9,400 per sq ft in late 2025 to ₹10,500 by Q2 2026. That should not be mistaken for a locality average, but it illustrates why Wakad ₹9500-₹10500 per sq ft in August 2026 is becoming a familiar buyer search. (SquareYards)
Hinjawadi remains the employment anchor. Hinjewadi phase-wise appreciation in Q3 2026 increasingly requires buyers to distinguish between mature Phase 1, newer residential supply and peripheral Phase 2/3 locations rather than treating Hinjawadi as one uniform market.
And Mahalunge, often marketed as a Baner-adjacent growth location, continues to attract buyers seeking the West Pune story at a different entry point. The requested Mahalunge ₹11669 per sq ft Baner Annex Q3 2026 figure should be treated as a project/listing-level benchmark unless supported by a consistent registered locality dataset, not as an established locality-wide average.
Affordable Pune Is Still Alive; But It Is Moving Outward
Despite premiumisation, affordability has not disappeared. It has moved geographically.
Moshi, Chikhali, Punawale, Tathawade, Wagholi and South Pune pockets such as Undri-Pisoli remain important entry markets.
NoBroker places broad Moshi and Wagholi rates around ₹5,000–₹8,000 per sq ft. Individual registered/project data can sit below or above that range; for example, Square Yards reports a ₹6,800 registered rate for one Moshi project over its stated August 2025–July 2026 transaction period. (SquareYards)
That makes Moshi Chikhali ₹4700-₹6800 per sq ft Q3 2026 plausible as a search-oriented entry range for selected inventory, but not a blanket market rate.
Similarly, Undri Pisoli, South Pune affordable Q3 2026 remains relevant for buyers prioritising ticket size over immediate proximity to major western or eastern IT hubs.
The Tathawade-Punawale-PCMC growth belt Q3 2026 occupies a slightly different position: it increasingly combines affordability with access to Wakad-Hinjawadi employment, making it attractive to first-time buyers who have been priced out of established West Pune.
The affordable market has not vanished. The commute attached to affordability has simply become part of the price.
Supply Is Surging; But Developers Are Reading Buyers Carefully
One of the strongest Q3 signals actually came at the end of Q2.
Cushman & Wakefield recorded 13,756 residential launches in Q2 2026, the highest quarterly supply in three years. The NH4 Bypass North submarket accounted for about 41% of launches, followed by North-East at 28% and North Peripheral at 13%. (Cushman & Wakefield)
The composition is equally revealing.
Mid-segment housing accounted for roughly 41% of Q2 launches, while high-end housing contributed about 37%. (Cushman & Wakefield)
Compare that with Q1: Cushman & Wakefield reported 11,371 launches, with mid-segment homes representing 46% of quarterly supply. (Cushman & Wakefield)
Developers are therefore adding substantial inventory while maintaining exposure to both middle-income and premium demand.
This does not look like a market betting everything on luxury.
It looks like a market hedging across buyer classes while pushing the overall product upward.
Offices, GCCs and Manufacturing Are Still Feeding Housing Demand
Housing demand does not exist in isolation.
Cushman & Wakefield reported Pune office gross leasing of 3.22 million sq ft in Q2, taking H1 leasing to 5.31 million sq ft. GCCs contributed more than half of quarterly office leasing, while flexible workspace, IT-BPM and BFSI companies were important demand sources. (Cushman & Wakefield)
This gives substance to the GCC IT automotive manufacturing employment demand driver Pune narrative.
Pune is unusual because it is not dependent on one employment engine. IT and GCC growth supports Kharadi, Hinjawadi and surrounding residential corridors, while engineering, automobile and manufacturing activity supports northern and industrial belts.
Cushman & Wakefield also recorded 4.2 million sq ft of industrial leasing in H1 2026, led by engineering, manufacturing and automobile occupiers. (Cushman & Wakefield)
That diversification matters when evaluating whether Pune real estate is still worth investing in 2026.
Housing ultimately needs jobs. Pune has several employment ecosystems creating them.
Are Pune’s “Hidden Gems” Really Delivering Triple-Digit Returns?
This is where the Pune property market Q3 2026 original research needs some restraint.
Searches now highlight extraordinary figures such as Bhor 180% appreciation 3 years hidden gem, Kamshet 172.7% appreciation emerging investment, Adarsh Nagar 117.7% Pune hidden appreciation, Lullanagar 62% central Pune appreciation Q3 2026, and Chandkhed 60% underrated Pune micro-market.
Some of these figures do appear in portal or developer-market commentary. For example, a current Kothrud market guide cites Bhor at 180% and Kamshet at 172.7% three-year appreciation, while Naiknavare cites three-year growth of 62.3% in Lullanagar and 60% in Chandkhed. (Synergy Infracon)
But buyers should be careful.
A 180% portal price movement in a low-volume peripheral location is not equivalent to a 180% realised investment return. Changes in inventory mix, a small number of listings, land versus apartment composition and a low starting base can dramatically influence such statistics.
The Adarsh Nagar 117.7% figure could not be independently established from a strong current source during this review and should therefore not be published as fact without the underlying dataset.
Hidden gems make good headlines. Transaction depth, liquidity and verified registered prices make better investments.
Should You Buy a Flat in Pune Right Now or Wait?
This is arguably the most valuable question in the entire Pune real estate data Q3 2026 price trends discussion.
The evidence does not currently point to a broad Pune price correction.
Capital values increased 5.4% quarter-on-quarter in Q2, according to Cushman & Wakefield, while CRE Matrix shows citywide average residential prices 20% higher than H1 2022. (Cushman & Wakefield)
But there are signs of buyer resistance. January 2026 Pune district registrations, for example, were down 17% year-on-year at 14,537, although stamp-duty revenue declined by a smaller 5%. (Mid-Day)
Meanwhile, CRE Matrix says overall housing sales have moderated from recent exceptional highs. (PuneNow)
So will Pune property prices go down in Q3 2026 or later?
A citywide fall is not the base case suggested by current evidence. But slower sales can create more negotiation room in specific projects, particularly where developers carry competing inventory.
Q3 2026 looks more like a consolidation phase than the beginning of a crash.
For end-users who have a stable income, adequate down payment, five-plus-year horizon and a project that passes legal and pricing checks, waiting purely for a citywide correction could prove unproductive.
For investors chasing a locality solely because it rose 20% last year, patience may be considerably wiser.
Pune Q3 2026: What Buyers Should Watch Next
The Pune property market outlook Q3 2026 forecast will depend on what happens through September.
Three signals deserve attention: whether the Q2 launch surge translates into healthy absorption, whether premium demand continues without weakening the ₹50 lakh–₹1 crore core market, and whether employment-led corridors continue to outperform purely speculative peripheral locations.
The bigger picture remains striking.
Pune sold 4.28 lakh homes between 2021 and 2025, the highest reported total among Indian cities in the CREDAI Pune-CRE Matrix comparison, averaging roughly one home every six minutes. (Punekar News)
Now the city is entering another phase.
The 2026 Pune buyer is spending more, demanding more and becoming more selective. Developers are responding with record recent supply, more premium inventory and increasingly sophisticated projects around employment corridors.
That makes Q3 less about asking whether Pune real estate is “booming” and more about identifying which parts of the market can justify today’s prices.
Follow the Data, Not the Hype
For anyone asking Should I buy a flat in Pune right now or wait for prices to fall, the answer should come from the micro-market, not a citywide headline.
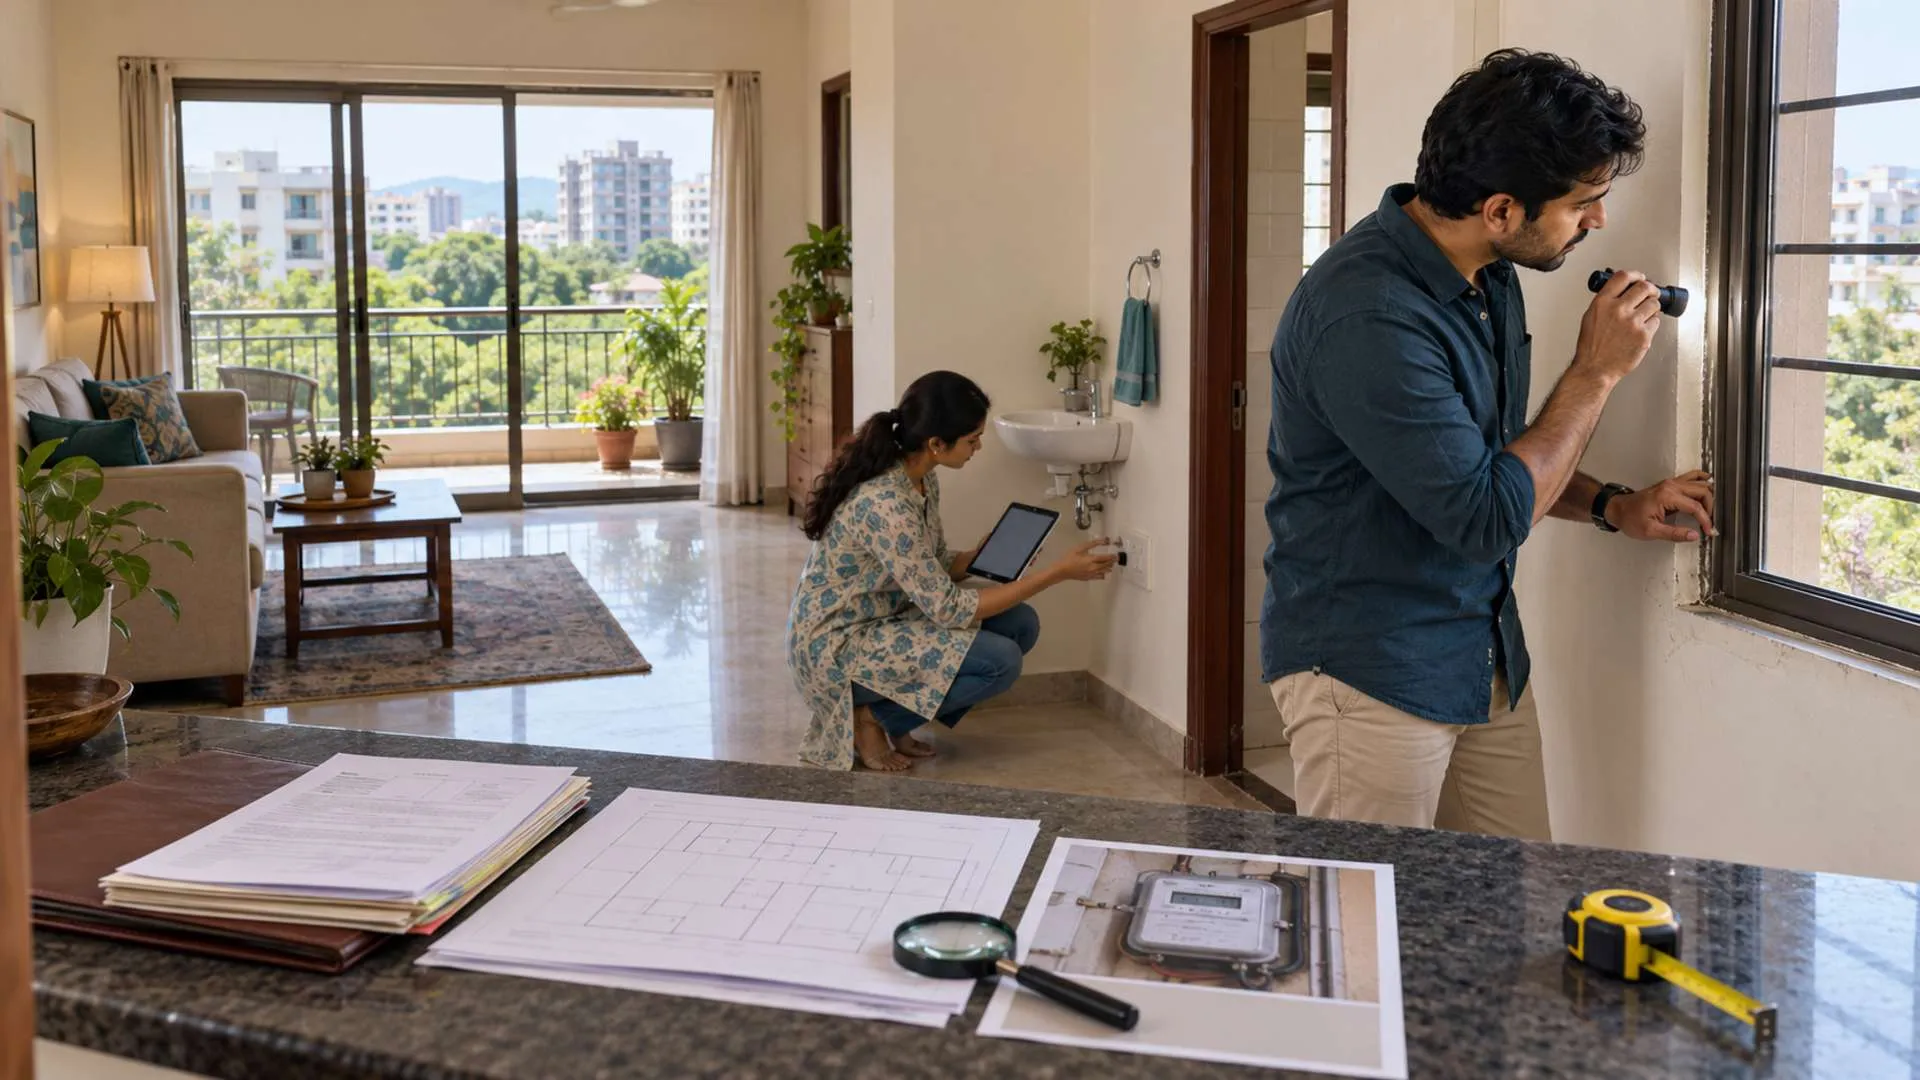
Compare registered transaction values, current inventory, MahaRERA disclosures, rental demand, employment access and actual project pricing before booking. A ₹6,000-per-sq-ft property in the wrong corridor can be more expensive in the long run than a ₹10,000-per-sq-ft home with stronger demand.
Pune remains one of India’s most active housing markets entering Q3 2026. But in the next stage of this cycle, the winners may not be the buyers who enter fastest; they may be the ones who read the data best. (CRE Matrix)